Phase calibration Fringe Fitting
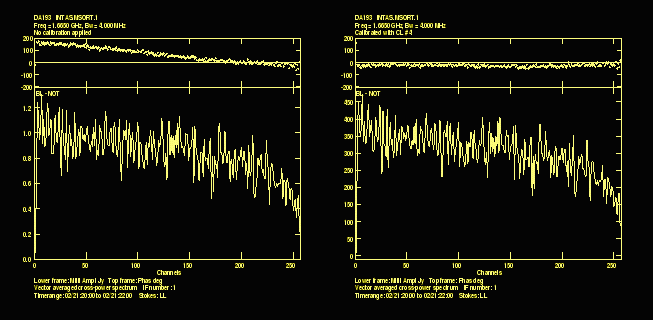
Left: A POSSM plot of the uncalibrated spectrum of DA 193 at 1.66 GHz on a baseline Bear Lakes to Noto. The plot shows spectrum for a single IF to show the effects of the residual delay error more clearly. The phase slope as a function of frequency is clear evidence for a small delay error in the correlator model.
Right: The same data as shown on the left, but corrected for a delay error and a residual fringe rate. Note how the phase as a function of frequency is now flat. These data can now be averaged in frequency, if desired.
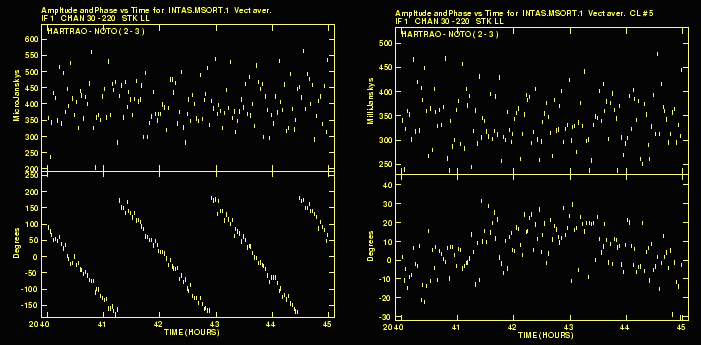
Left: A VPLOT plot of the uncalibrated amplitude (upper frame) and uncalibrated phase (lower frame) as a function of time for the source DA 193 on a baseline HartRAO to Noto. Note how the phase varies as a function of time. Unless the fringe rate is determined and removed, the data cannot be averaged in time.
Right: The same data as shown on the left, but corrected for the fringe rate. These data can now be averaged in time, if desired.