The 58th Session of International Astronautical Congress (IAC)
September 24-28, 2007
Hyderabad, India
Statistical Analysis Of the ESA Optical Space Debris Surveys
Thomas Schildknecht, Tim Flohrer, Reto Musci
Astronomical Institute, University of Bern, Switzerland
Rüdiger Jehn
ESA ESOC, Darmstadt, Germany
Introduction
- Primary objective of all space debris measurement programs
- improved knowledge on the debris environment in specific orbital regions
- number of objects
- object sizes distributions
- nature and origin of the objects
- additional characteristics
- Ideally: maintained catalogue of space debris, but…
- Statistical data
- derive spatial fluxes
- input data for spacecraft designers
- asses collision risks
- devise efficient space debris mitigation measures
- Fluxes from statistical optical observation data
- All methods require that some parameters or statistical properties of the debris population have to be assumed.
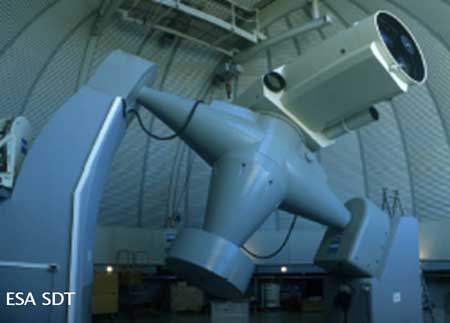
ESA 1-m Telescope (OGS)
OGS (Optical Ground Station)
- 1m aperture
- f=4.4 m
- 4k x 4k CCD
- FOV 0.7°
|
Used for:
Surveys, faint objects follow-up
|
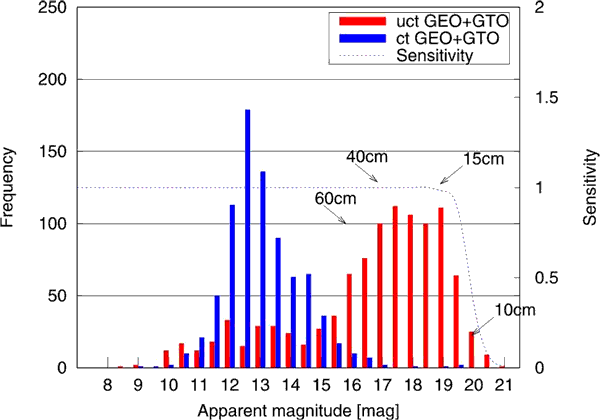
2006 Survey
GEO observation scenario 2006
GTO observation scenario 2006
- Simulate observations for model populations
- use detailed observation scenarios of 2006
- 4 Monte Carlo runs
- GEO population with homogeneously distributed orbital elements:
- analyze selection biases in the orbital element space
- ‘artificial clusters’?
- GEO catalogue population
- direct comparison with 2006 survey
- coverage in the orbital element space
- MASTER population
- independent validation of the MASTER-2005 model
- GOAL:
- from simulation: Ndet/Nobj
- from observations: NUCT(detections) → Nobj
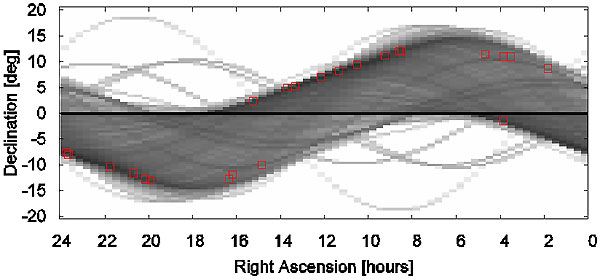
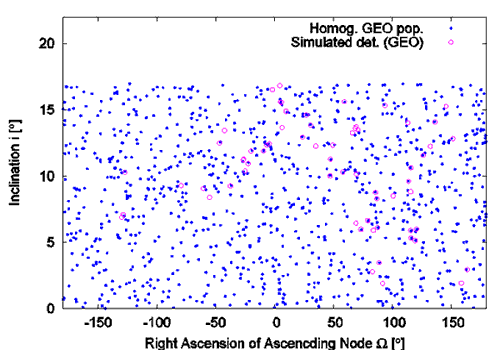
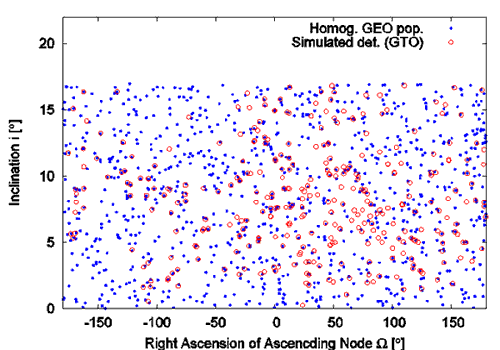
Homogeneous GEO Population
- 1000 objects with equally distributed orbital elements:
- semimajor axis: [40164km, 44164km]
- eccentricity: [0, 0.1]
- inclination: [0°, 17°]
- node: [0°, 360°]
- perigee: [0°, 360°]
- mean anomaly: [0°, 360°]
- No S/N limit → only "geometry"
GEO scenario
|
| Simulated | 1000 |
| Detections | 119 |
| Objects | 92 |
| Ndet/Nobj | 1.3 |
|
GTO scenario
|
| Simulated | 1000 |
| Detections | 334 |
| Objects | 277 |
| Ndet/Nobj | 1.2 |
GEO & GTO
| Simulated | 1000 |
| Detections | 453 |
| Objects | 369 |
| Ndet/Nobj | 1.3 |
|
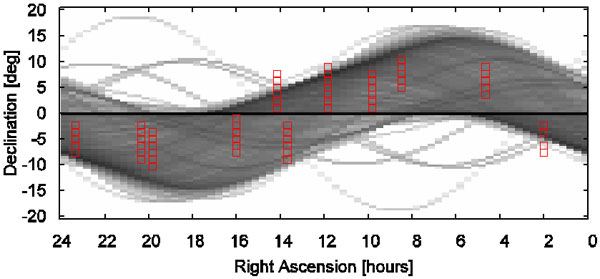
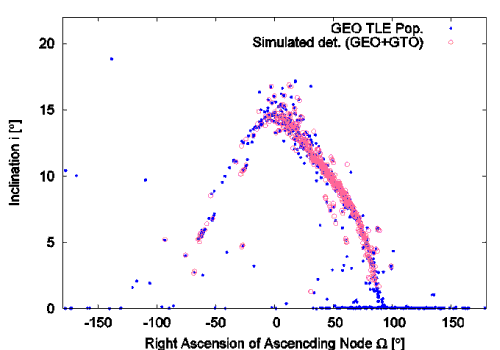
Catalogue Population
GEO and GTO scenario
|
| GEO |
| Detections | 461 |
| Objects | 212 |
| Ndet/Nobj | 2.2 |
| GTO |
| Detections | 349 |
| Objects | 229 |
| Ndet/Nobj | 1.5 |
| GEO & GTO |
| Catalogue | 349 |
| Objects | 347 |
| Survey | 320 |
|
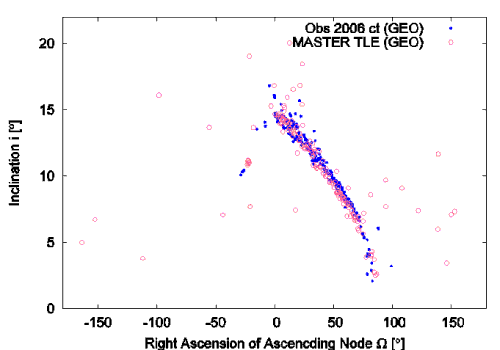
MASTER-2005 Population
GEO scenario; Survey CTs, MASTER "TLE detections"
|
| MASTER |
| Det. TLE | 460 |
| Obj TLE | 195 |
| Ndet/Nobj | 2.2 |
| Survey |
| Det. CT | 476 |
| Obj CT | 187 |
| Ndet/Nobj | 2.6 |
Consistent |
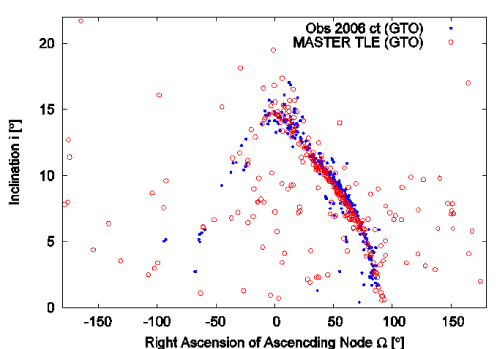
GTO scenario; Survey CTs, MASTER "TLE detections"
|
| MASTER |
| Det. TLE | 378 |
| Obj TLE | 242 |
| Ndet/Nobj | 1.5 |
| Survey |
| Det. CT | 332 |
| Obj CT | 229 |
| Ndet/Nobj | 1.5 |
Consistent |
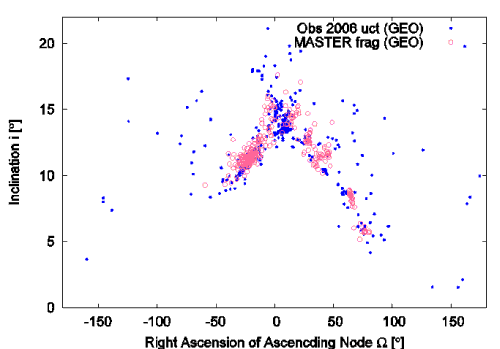
GEO scenario; Survey UCTs, MASTER fragments
|
| MASTER |
| Det. Frag | 628 |
| Obj Frag | 450 |
| Ndet/Nobj | 1.4 |
| Survey |
| Det. UCT | 461 |
| Obj UCT | ? |
| Ndet/Nobj | ? |
Too many
Master Fragments |
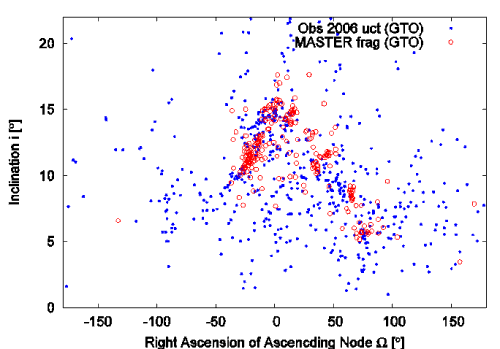
GTO scenario; Survey UCTs, MASTER fragments
|
| MASTER |
| Det. Frag | 838 |
| Obj Frag | 242 |
| Ndet/Nobj | 3.5 |
| Survey |
| Det. UCT | 579 |
| Obj UCT | ? |
| Ndet/Nobj | ? |
Too few
Master Fragments |
Detections-to-objects ratios
Survey
Scenario | GEO
Homogeneous | MASTER
Population | Catalogue
|---|
| GEO | 1.3 | 1.4 | 2.2 |
| GTO | 1.2 | 1.2 | 1.5 |
| GEO/GTO | 1.3 | 1.5 | 2.3 |
1040 UCT detections in 2006 survey
- Ndet/Nobj = 1.3 (catalogue pop.) → ~800 objects
- Ndet/Nobj = 1.5 (MASTER pop.) → ~700 objects
- Ndet/Nobj = 2.3 (homog. pop.) → ~450 objects
- Fictitious homogeneous GEO population:
- Sampling homogeneous in (i-Ω) orbital element space
- 35% of the simulated objects detected
- GEO catalogue population:
- ~40% of the catalogue population detected in the simulation
- ~36% of the catalogue were actually observed (320 out of 879)
- MASTER-2005 population
- over-predicts the number of fragments in orbital planes similar to the catalogue population
- predicts too few debris for other orbital planes (missing high area-to-mass ratio population in the model!)
- ESA 2006 survey
- has seen 450 to 800 uncatalogued debris objects, ~700 assuming MASTER population characteristics
29 сентября 2007
Доклад публикуется с разрешения авторов
|