


|
|
|
|
|
|
|
|
DENSITY VARIATIONS IN THE UPPER ATMOSPHERE DURING SEVERAL SOLAR CYCLES DETERMINED FROM SATELLITE DRAG MEASUREMENTSStephen H. KnowlesScience Applications International Corp. 1710 SAIC Drive McLean, VA 22102, U.S.A.
INTRODUCTIONMuch attention has been paid to the accuracy with which atmospheric models reproduce the atmospheric density, and thus drag, experienced by a satellite. However, there has been
relatively little attention paid to the actual range of atmospheric density encountered by an
object at various altitude regimes. This distribution is in fact important to satellite orbit
designers and maintainers, to satellite catalog designers, and to collision avoidance specialists
because it represents the range of parameters to design against. Use of atmospheric models
and real-time density measurement can ameliorate this somewhat, but this compensation is
imperfect. To the extent this compensation fails, the relative density distribution represents
the drag uncertainty that must be designed against. Therefore it was thought of interest to
provide as comprehensive an examination as possible of measured drag. The Naval Research
Laboratory has recently obtained from Strategic Command element sets and observations
from 32 satellites, in many cases going back to the start of the space-faring age. This database
has been used by Emmert et all to determine long term mean density fluctuations, and is thus
relatively well characterized. This article describes sampling from this database.
DATA BASE AND DATA EXTRACTIONThe Naval Research Laboratory (NRL) has recently obtained a complete data base of element
sets and observations for 32 objects from the USSpaceCom skin-track catalog. The objects
were selected to cover as wide as possible a range of altitudes while maintaining as long a
time span as possible. In fact it was possible to obtain a perigee altitude range of from 211
km. (approx.) to 900 km with a time span from near the start of the space age to the present.
Resource limitations associated with this project necessitated simplifying the data analysis as
much as possible. As a consequence, the results described in this article are semi-qualitative,
and further work is indicated. However, given the paucity of comparable analysis, this should
represent considerable new information. Table I shows the objects discussed in this article. Perigee and apogee are nominal values in 2002. These objects were selected to give a well-
observed mid-altitude object (#60), the object with the lowest perigee (6073) and the object
with the highest perigee (6073).
Table I
The 2-line NORAD elsets have attached a drag parameter n dot that is related to
atmospheric drag over the orbital fit span. Using these numbers is an alternative to using
Space Surveillance Network observations and performing special perturbations integrations
over the interval in question. This is in fact what was done for this investigation because of
the limited time and resources available. Using n dots has possible disadvantages. The operational fitspan of three days or longer must be accepted,
limiting the time resolution. n dot must be related to the inverse ballistic coefficient in order
to come up with a density measurement. On the other hand, the operational orbit analyst has
already performed the sometimes-crucial function of discarding bad observational data, in a
knowledgeable manner. In order to relate n dot to B, the inverse ballistic coefficient, an
equation such as that in Emmert et all must be used. However, in order to determine relative
mean density over time, which is the object of this contribution, this is not necessary; in this
case the values are automatically normalized. This argument also applies to the fact that
explicit knowledge of the mean value of B is not necessary.
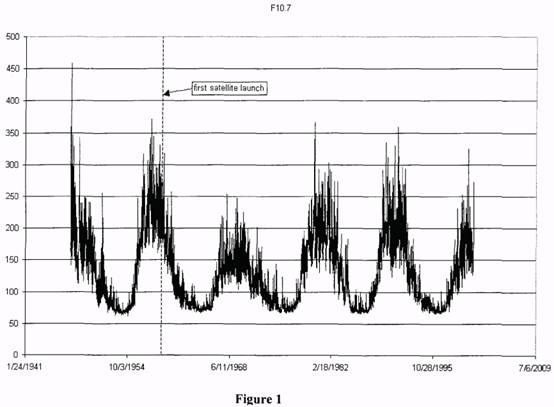
DATA ANALYSISFrom the time span examined, a comprehensive view of the range of the solar/geophysical
indices F10.7 and Ap was available. Figure 1 shows the values of F10.7 over the whole time
period this index has been available; also shown is the period available for comparison to
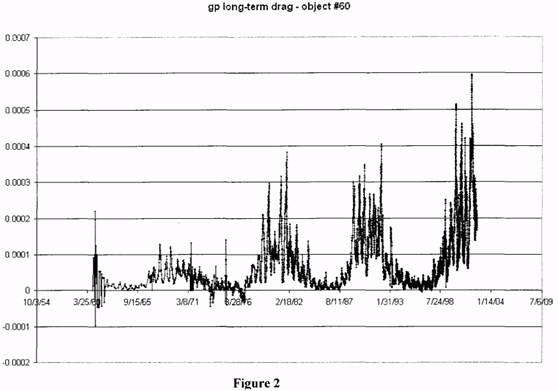
satellite drag measurements. Figure 2 shows the value of n dot for object #60 for 1961-2002.
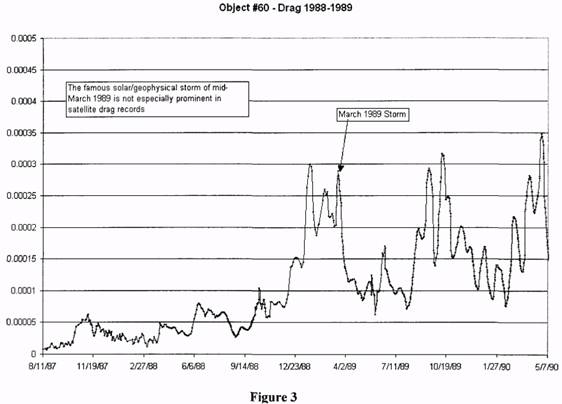
This encompasses almost 4 solar cycles. Figure 3 shows that, surprisingly, the drag measured
during the well-known event of March 1989 was not significantly greater than other drag
peaks. Figure 2 shows a large secular increase in drag. It was obvious from this plot that the
secular long-term energy loss (decrease in semi major axis) would need to be compensated for
in this analysis. This was done by normalizing with respect to the mean density at altitude of
date computed from the CIRA-72 model (Valladof A static model was chosen purposely so as
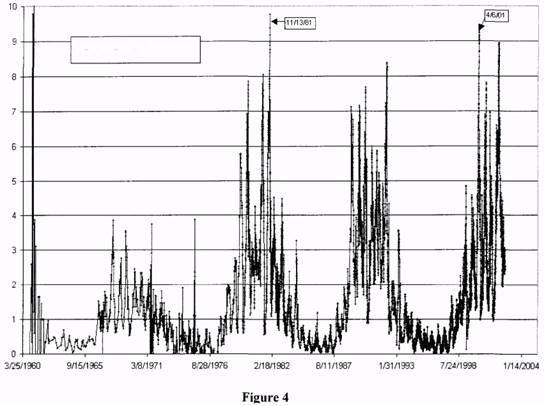
not to affect solar cycle variations. When this correction the secular trend in drag vanishes
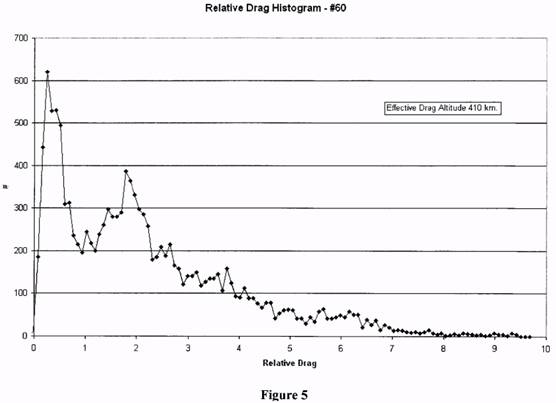
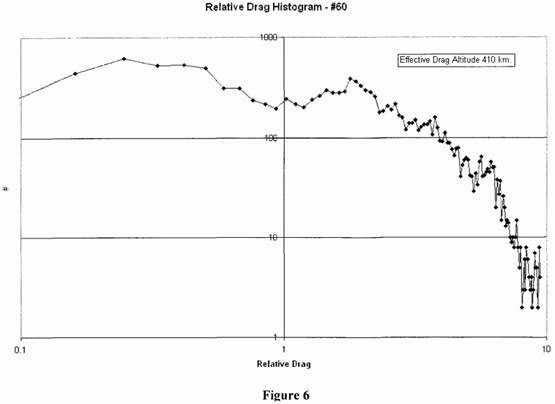
(Figure 4). From the corrected n dots, a histogram was derived of relative drag (Fig. 5). Figure
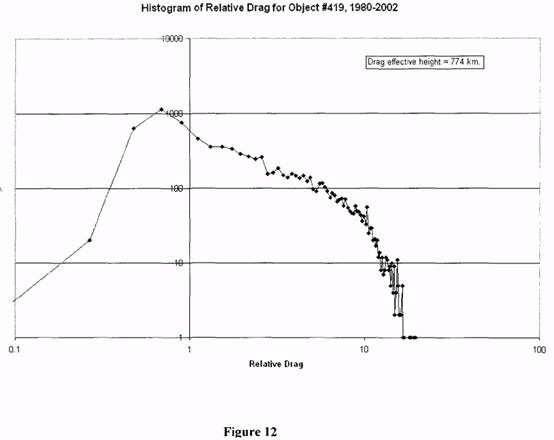
6 displays the same histogram with a log-log scale. The log-log scale is particularly effective
in addressing questions of shape of the distribution. With high eccentricity objects the
question of the effective altitude for drag purposes must be addressed. The approximation
that the effective drag altitude is 1/2 scale height higher than the perigee altitude was used here.
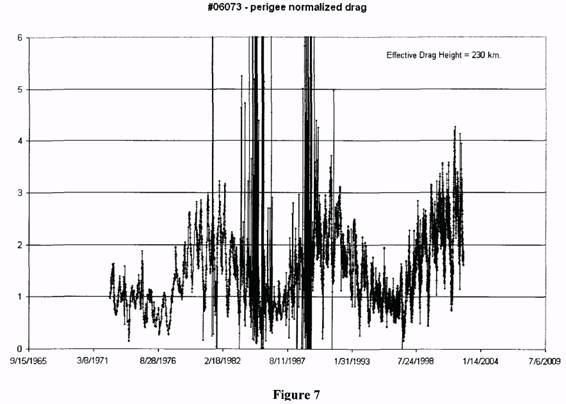
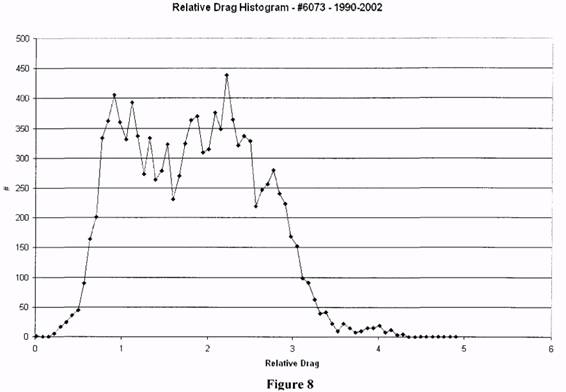
The next step was to analyze the data from the object with the lowest perigee.
Results for #6073, with an effective altitude of 230 km., are shown in figs. 7-9. Note
that in this case only the n dot data from the last solar cycle are of sufficient quality to
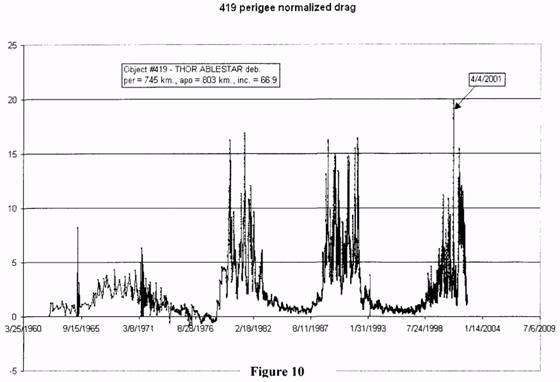
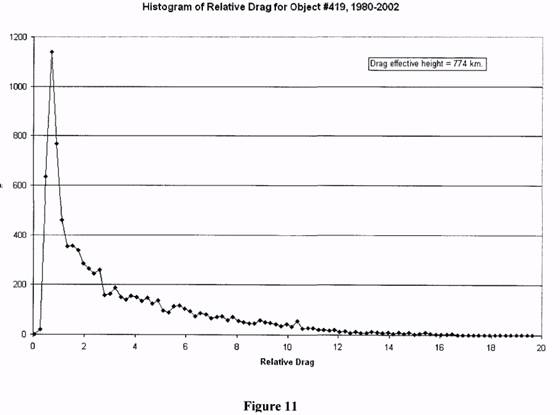
analyze. Similarly Figs 10-12 show the results for #419, with an effective drag height of about
775 km. Note that the spread of the distribution changes from 3:1 for the lowest altitude to 20: 1 for the highest. This significant effect is expected, and emphasizes the necessity of
considering drag variations even at relatively high altitudes. Note also that, at least within the
limited historical record, the drag appears to have a “do not exceed” value; that is, it will
never be more than a certain amount above the mean.
For all objects examined, the drag during the solar cycle peaking in 1971 was
significantly less than in later cycles. This data was eliminated from the histograms, as it was
thought it might be related to the change from SGP to SGP4 theory. On the other hand, the
1971 cycle was significantly less active than later cycles, and further analysis is called for to
clarify the validity of this data.
CONCLUSIONSThis limited-scope investigation has shown that it is possible from available data to provide a synoptic view of mean atmospheric density distribution as a function of altitude. This mean
density is the quantity of primary interest to all orbit engineers, bearing directly on questions
of lifetime, orbit accuracy, collision avoidance and cataloging. In general, drag results seem to
show a maximum density level that is not exceeded, as well as a minimum density level.
While the low density limit is expected, the upper density limit is somewhat surprising. The
ratio of maximum to mean drag varies from about 3:1 at 250 km. altitude to 20:1 at 900 km.
altitude. This higher level of variability at higher altitudes means that monitoring atmospheric
density can be important even for objects at altitudes of 1000 km. and above. Within the
maximum limit, the density generally follows a power-law distribution. The known major
storms (March 1989, Bastille Day 2000, Mar.-ApriI2001) did not produce densities
significantly larger than other similar but less notorious events.
This preliminary, limited scope investigation can be extended in a number of directions.
Analysis of the Space Surveillance Network observations using a tailored orbit fit would
produce a more consistent set of drag data that would hypothetically enable the use of data
before 1980 that has been excised for this contribution. It should enable use of shorter fit
spans to increase time resolution. The density distribution as a function of phase in the solar
cycle should be easily determinable. The inclusion of more objects will increase the statistical
validity of the results. Lastly, it should be possible to produce a simple mean density model
by simply computing the regression coefficient of drag on F10.7 and Ap. This model
nevertheless would address the principal interest of the satellite engineering community,
which is the average drag magnitude over the fitspan.
Acknowledgements. The author wishes to acknowledge A.C. Nicholas and S.E. Thonnard, who
collaborated on a previous version of this work.
REFERENCES
           Размещен 3 декабря 2006.
|
|
|
|
|
|
|
|
|