


|
|
|
|
|
|
|
|
RE-ENTRY PREDICTION AND ON-GROUND RISK ASSESSMENTH. KlinkradEuropean Space Operations Center, ESA/ESOC, Darmstadt, Germany
INTRODUCTIONOf more than 28,000 Earth orbiting objects which USSPACECOM has tracked since 1957,
some 19,000 have re-entered into the atmosphere by the year 2004. Most of these objects
disintegrated and burnt up, posing only a minor risk on ground. In 2004 the number of
unclassified, correlated objects in the USSPACECOM catalog was on the order of 9,000. Due
to the limited sensor sensitivities, all of these objects have diameters larger than 10 to 30 cm.
Out of the catalog population, about 1 object re-enters each day, and 1 to 2 objects with a
radar cross-section (RCS) larger than 1 m2 re-enter each week. The latter ones, which have a
radius of about 1 m, have an increased survival potential, and they are generally followed
more closely by USSPACECOM until their final entry.
At rates of one in several years orbital structures re-enter, which have geometric cross-
sections of 100 m2 or more, and masses of several 10 tons. Such spacecraft can be classified
as high-risk objects, since they produce a significant mass percentage of break-up fragments which can withstand the aerothermal heat flux and structural loads during re-entry, and which
can generate ground impacts with significant risk levels to the population within the debris
swath. Theoretical analyses and object retrievals suggest that 10% to 40% of the mass of a
large spacecraft can survive to ground impact. Historic examples of this category were the re-
entries of Skylab (on 11-Jul-1979, with a mass of 74t), and Salyut-7 (on 07-Feb-1991, with a
mass of 40t). The latest, most massive object in space history to re-enter was Mir (on 23-Mar-
2001, with a mass of 135 t). The decays of these large space structures will be used to analyze
results of ESA's re-entry risk analysis methods. In early 2005 ESA will distribute the
DRAMA software (Debris Risk Assessment and Mitigation Analysis). It also assesses re-
entry survivability and on-ground risk, in support of ESA's Space Debris Mitigation
Handbook and future European Debris Mitigation Standards. A preview of this software will
be provided.
RE-ENTRY PREDICTIONTo monitor and forecast the long- to medium term evolution of an uncontrolled re-entry over
periods of several years to a few weeks of the remaining lifetime, computationally efficient
yet sufficiently accurate methods must be applied. For this purpose ESA uses a program
called FOCUS-2. It integrates the combined time rates of change of singly averaged
perturbations equations, taking into account a non-spherical Earth gravity potential, a dynamic
Earth atmosphere, luni-solar gravity perturbations, and solar radiation pressure in combination
with an oblate, cylindrical Earth shadow. The integration is performed by a robust 4th order
Adams-Bashforth/Adams-Moulton predictor/corrector method, which is initiated by a self-
starting 4th order Runge-Kutta-Fehlberg method, using fixed time steps of typically 0.1 to 5
orbits, depending on the time to go until reentry.
Perturbations from the Earth gravity potential are expressed in terms of the Lagrange
equations for a truncated EGM-96 gravity model up to degree n ≤ 23 and order m ≤ n. To
compute the derivatives of the Earth's gravity potential, the spherical harmonics are developed
in recursively computed expansions, using inclination functions and eccentricity functions
according to [7]. The infinite expansions in eccentricities reduce to finite summations after the
analytical averaging operation with respect to mean anomaly M. A second order Earth
oblateness perturbation term (J2)2, adopted from [12], is superimposed on the results. Third
body effects are computed for point masses of the Sun and Moon, applying analytical
ephemerides. Again, the Lagrange equations are used, with recursive expansions of the
perturbing third body potential in inclination and eccentricity functions according to [3]. As
for the geopotential, the perturbation equations are averaged with respect to the mean
anomaly, maintaining the positions of Sun and Moon constant over the averaging time
interval of one orbit. The direct solar radiation pressure perturbations are determined with
Aksnes' theory [1] for a given area-to-mass ratio A/m and momentum exchange coefficient CR.
The perturbation equations are averaged in a closed form over the illuminated orbit arc, taking
into account an oblate, cylindrical Earth shadow.
The main effort in the FOCUS-2 perturbation model is concentrated on the aerodynamic
drag effects. They are computed from the Gauss perturbation equations, which are expressed
in terms of first order (J2) osculating elements, with the perturbing acceleration p and its
components pa,U, pa,V, and pa,W in the radial, transversal, and out-of-plane direction. First
order velocity corrections due to short periodic Earth oblateness effects are accounted for, and
optional East and North wind components are provided by a horizontal wind model [6], which
is superimposed on the Earth rotation rate. Local air densities are determined with the MSISe-
90 model [5], based on observed and predicted solar and geomagnetic activity proxies F10.7,
F10.7, and Ap.
In spite of several decades of research effort, the model accuracy for total densities is in
general on the order of Δρ1σ ≈ 15%, even for perfectly known input parameters. In phases of
extreme solar or geomagnetic activities local density errors can temporarily exceed 100%.
Even at mean activity levels differences between individual thermosphere models can be
appreciable. This is particularly so at low altitudes of 120 km ≤ z ≤ 200 km, when comparing
drag based models (e.g. CIRA-72), which integrate the diffusion equations for empirical
temperature profiles, with mass-spectrometer based models (e.g. MSIS-86), which use
analytical approximations of the diffusion and temperature profiles. In the course of the MSIS
model developments the analytical profiles were adjusted to provide best fits at altitudes
where most of the in-situ measurement data are concentrated. Since the shapes of the density
profiles are fixed according to analytical expressions, the good fit at higher altitudes is
achieved at the expense of larger model errors at low altitudes, where in-situ measurement
data are sparse. As a consequence, the differences between CIRA-72 and MSIS-86 at low
altitudes can reach 30% to 40%. From monitoring re-entry events one can conclude that drag
based models (e.g. CIRA-72 or GOST-85) are mostly superior in accuracy at low
thermospheric altitudes, and should get preference for final orbital decay predictions. The
advantages of both model types (drag based at low altitudes and mass-spectrometry based at
higher altitudes) can be combined in a hybrid model, for instance by an overlay of MSISe-90
and CIRA-72 density profiles, with altitude dependent weighting.
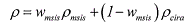 (1) (1)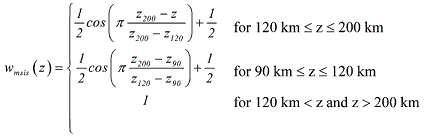 According to Eq. 1 the MSISe-90 model is used above 200 km and below 90 km, the CIRA-72 model is used near 120 km (homopause), and a smooth fairing between the two density
profiles is used at intermediate altitudes.
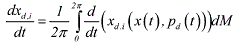
The mean rates of change due to aerodynamic drag xd,i = a∙d, ..., M∙d, are determined
by means of a 21-point Gauss-Legendre quadrature according to Eq. 2, based on the drag
perturbation equations, expressed in osculating elements x = (x1, ..., x6), with drag perturbations p = (pu, pv, pw) in an orbit oriented coordinate system.
 (2) (2)In the case of uncontrolled, natural re-entries, mainly due to aerodynamic drag, the
orbital evolution of an object can only be monitored, with no or only limited possibilities to
control the risk. Based on an observation and orbit determination history, solar and
geomagnetic activity forecasts, and assumptions on the attitude dynamics, the re-entry time of
a spacecraft can be predicted with typical accuracies of ±10% to ±20% of the remaining
orbital lifetime. If no detailed results of a break-up analysis are available, one may assume
that, depending on the entry angle and breakup altitude, the final ground dispersion of
fragments can extend over more than ±2000 km along track and ±80 km cross track. Prior to
the entry, the along track spread is governed by a ±20% uncertainty in the predicted re-entry
epoch. The cross track extension of ±80 km remains almost unaffected, though the reference
ground track drifts according to the altitude decay history. Based on the analysis of 15 historic re-entry events, we shall assume that the 2σ extension of the fragment dispersion area on
ground is an ellipse, which is symmetric to the predicted COIW location (center of impact
window), both in the along and cross track direction. The resulting probabilities of an impact
within a 1σ, 2σ, and 3σ ellipse and rectangle are listed in Tab.1.
Table 1. Integrated impact probability for elliptic and rectangular fragment
dispersion areas of 1σ, 2σ, and 3σ extensions along track and cross track.
RE-ENTRY SURVIVABILITYOne of the key issues in re-entry risk analysis is the identification of components of a
spacecraft which are likely to survive the deceleration and heating peaks following a break-up
event at altitudes of typically 75 to 80 km. Simulations predict that certain materials (e.g.
stainless steel and titanium), and certain shapes (e.g. tanks) have a high potential of re-entry
survival, particularly if high melting temperatures are combined with low area-to-mass ratios.
The retrieval of such objects at several re-entry sites has supported these assumptions (e.g.
Delta-2 stainless steel tanks of 250 kg mass, and Titanium spheres of 30 kg mass which were
retrieved in Texas on 22 Jan 1997, and in the Cape Province of South Africa on 27 Apr 2000).
To predict the survival or demise of a re-entering object is a very complex exercise, in
particular for complex spacecraft shapes with appendices and heterogeneous material
compositions. In the most general case, a detailed computer model is necessary to define the
spacecraft geometry, for a wide spectrum of material properties, and for the whole
temperature range which is experienced during a re-entry. Based on initial orbit and attitude
conditions at a given epoch the 6 degrees of freedom (DoF for orbit and attitude), or 3 DoF
dynamic state equations (orbit only) can then be propagated to the first break-up event.
During this propagation, the aerodynamic and aerothermal state are continuously adjusted for
changing flight regimes, and the resulting heat flux is entered into the thermal analysis which
establishes the temperatures inside the spacecraft and on its surface, in order to adjust
temperature dependent material properties, and to initiate ablative mass loss, where
applicable. Corresponding changes in shape and mass properties of the spacecraft are
dynamically accounted for, and they are fed back into the mass and inertias. This concept is
implemented in ESA's SCARAB software [4] for 6 DoF, and in NASA's ORSAT [2] and
ESA's DRAMA code [10] for 3 DoF dynamics.
For simple shapes of given material properties (see Tab.2), and for 3 DoF flight dynamics (no attitude propagation), results of different re-entry prediction tools can be validated
analytically, or against independent numerical tools. For such simple bodies, thermal
disintegration only may be considered, where for each volume element (voxel) the heat
balance from convective, conductive, and radiative heat inputs and outputs is determined.
Depending on the temperature level reached, two cases can be distinguished:
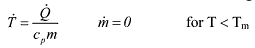 (3) (3)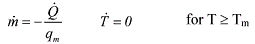 (4) (4)In eq.3 and 4, Q• is the heat storage (Q• > 0), or heat loss (Q• < 0), T is temperature of
the voxel, V is volume of the voxel, ρ is the density of the material, cp is the heat capacity at constant pressure, qm is the heat of melting (melting enthalpy), and Tm is the melting
temperature.
Starting at typical initial conditions of a natural re-entry (e.g. altitude He = 200 km, velocity Ve = 7.8 km/s, and flight path angle γe = 2.5°), the integral heat flux during the free-molecular and continuum laminar flow regimes can be integrated along the trajectory. The re-radiation from the body surface may be considered according to
 , where Teq is the equilibrium surface temperature, assuming a perfectly heat conducting material, and solid
objects of simple geometric shapes. A complete demise is assumed, if the equilibrium
temperature Teq at the time of peak heat flux exceeds the melting temperature Tm. Based on an exponential atmosphere the peak heat flux q•max can be approximated analytically, for initial entry conditions, and object properties [11]. One can thus obtain the demise altitude as a
function of the size, shape, and material. Such analytical results compare well with numerical
verification outputs produced by ESA's numerical SCARAB software (see Tab.3). , where Teq is the equilibrium surface temperature, assuming a perfectly heat conducting material, and solid
objects of simple geometric shapes. A complete demise is assumed, if the equilibrium
temperature Teq at the time of peak heat flux exceeds the melting temperature Tm. Based on an exponential atmosphere the peak heat flux q•max can be approximated analytically, for initial entry conditions, and object properties [11]. One can thus obtain the demise altitude as a
function of the size, shape, and material. Such analytical results compare well with numerical
verification outputs produced by ESA's numerical SCARAB software (see Tab.3).
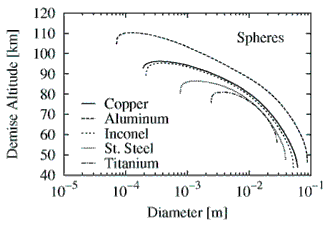
One can show [11, 10] that in free-molecular flow the demise condition is not dependent on
body size, whereas in laminar continuum conditions it is. All other dependencies on ambient
conditions, trajectory, and material remain unaffected. Fig.1 shows the result of a numerical
computation of demise altitudes of solid spheres as a function of object diameter and material.
The curves indicate that below a certain minimum diameter d < dmin and above a certain
maximum diameter d > dmax the objects tend to survive the re-entry. For d < dmin this is due to the low area-to-mass ratio (since
 ), and due to the resulting early deceleration at
high altitudes, with free-molecular heating, and with good re-radiation capabilities (since the
ratio re-radiation to heat storage goes with ). In case of large objects, where d > dmax, the altitude of peak heat flux is lowered into the laminar flow regime. In this case, the
increased heat storage capacity (which goes with ), and due to the resulting early deceleration at
high altitudes, with free-molecular heating, and with good re-radiation capabilities (since the
ratio re-radiation to heat storage goes with ). In case of large objects, where d > dmax, the altitude of peak heat flux is lowered into the laminar flow regime. In this case, the
increased heat storage capacity (which goes with  ) and the reduced integrated heat
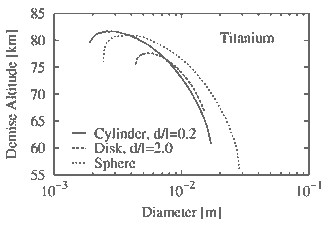
flux allows the object to survive. In general, Titanium has the best survival potential, followed
by stainless steel, Inconel, and Copper. Due to its low melting temperature and poor re-
radiation capability Aluminium has the lowest probability of survival. In case of solid, simple
bodies, the survival potential is to a lesser degree affected by the object shape (see Fig.2).
Even for a critical case (i.e. Titanium spheres), it is evident from Fig.1, that objects in the size
regime between 5 mm and 2 cm do not survive the re-entry, and they will hence not
contribute to the effective casualty cross-section at ground impact. This is an important
finding, since most screws, nuts, and bolts used in spacecraft and rocket manufacturing fall
into this domain. For the terminal velocity of solid spheres at ground impact the
proportionality ) and the reduced integrated heat
flux allows the object to survive. In general, Titanium has the best survival potential, followed
by stainless steel, Inconel, and Copper. Due to its low melting temperature and poor re-
radiation capability Aluminium has the lowest probability of survival. In case of solid, simple
bodies, the survival potential is to a lesser degree affected by the object shape (see Fig.2).
Even for a critical case (i.e. Titanium spheres), it is evident from Fig.1, that objects in the size
regime between 5 mm and 2 cm do not survive the re-entry, and they will hence not
contribute to the effective casualty cross-section at ground impact. This is an important
finding, since most screws, nuts, and bolts used in spacecraft and rocket manufacturing fall
into this domain. For the terminal velocity of solid spheres at ground impact the
proportionality  holds. Hence, the small survivor objects with d < dmin tend to carry a low risk potential due to their very low impact velocities ("rain down" effect). Re-entry objects which have sizes beyond the maximum demise diameter need to be analyzed
with more sophisticated numerical tools, such as ESA's DRAMA or SCARAB software [4, 10]. holds. Hence, the small survivor objects with d < dmin tend to carry a low risk potential due to their very low impact velocities ("rain down" effect). Re-entry objects which have sizes beyond the maximum demise diameter need to be analyzed
with more sophisticated numerical tools, such as ESA's DRAMA or SCARAB software [4, 10].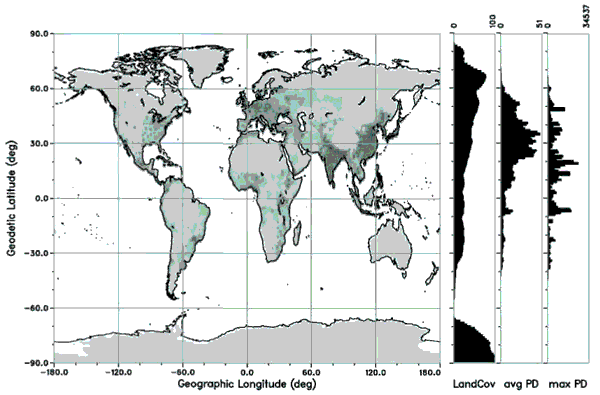 Fig. 3. World population density (1° x 1° cells). The small circle of latitude average of
land cover (in %), and of the mean and maximum population density (in 1/km2) is given to
the right.
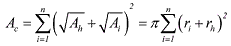
CASUALTY CROSS-SECTIONIn order to assess the on-ground risk due to surviving debris of a single re-entry event, the
NASA safety standard NSS 1740.14 [13] introduces an equivalent casualty cross-section Ac, which is composed of the cross-sections Ai of individual fragments, with each of them augmented by a projected human risk cross-section of Ah = 0.36m2 (corresponding to rh = 0.33 m). When assuming a vertical fall with an immediate rest upon impact, then the resulting effective cross-section for the i-th fragment is a circle of radius rci = ri + rh which circumscribes two touching circles of areas Ai = πri2 and Ah = πrh2. The total casualty cross-section is then determined by a summation over all n survivor fragments of a re-entry event.
 (5) (5)The quantity Ac is a simple, yet very efficient way to concentrate the entire knowledge on the breakup process of a re-entering spacecraft into a single figure. It allows a spacecraft
manufacturer to provide a means for a reliable re-entry risk assessment without disclosing
sensitive information on construction details. The individual contributions to the casualty
cross-section can be adjusted for the ground impact incident angle, for a re-bounce or slide on
the surface, and for splatter by fragmentation and radial ejection upon ground impact. A
theoretical analysis of Delta II survivor fragments indicated possible increases of the effective
area Ac by a factor of 1.9 to 4.8, depending on soft or hard ground surfaces.
POPULATION DENSITYPopulation density maps with sufficient spatial resolution are necessary to associate the
impact of re-entry survivor objects with a casualty risk in the affected groundtrack swath.
Fig.3 shows a world map of 1° x 1° mean population densities, derived from 5' x 5' (9.25km x
9.25km) high resolution data of the Global Demography Project [15]. These population data
for the year 1994 are supported by discretized maps of land masses. The total world
population in 1994 was 5.63×10+9, distributed over a total land surface of 1.48×10+8 km2, which accounts for 28.97% of the surface of the Earth reference ellipsoid. This corresponds to
a global mean population density of 11.0/km2, and to a mean land population density of
38.1/km2. By the year 2000, the world population had reached 6.23×10+9. This value is
predicted to double within the next 40 years.
Table 4. Land impact probability Pl, and casualty probability Pc, as a function of the orbit inclination (averaged over one orbit groundtrack, for a casualty cross-section of 10 m2, in the year 2000).
The histograms on the right hand side of Fig.3 give the small circle of latitude averages
of land cover (in %) and average population density (per km2), plus the maximum density in
each latitude band of 1° width. An imbalance between the northern and southern hemisphere
becomes evident from these charts. In fact, only 11.7% of the world population, and only
33.3% of the land masses are located south of the equator. This has a direct impact on an
equally imbalanced risk distribution between the hemispheres, with a much higher risk of re-
entry casualties at northern latitudes. A re-entry which occurs on the northern hemisphere
carries a 1.75 times larger risk than a global mean event. The corresponding risk for a re-entry
in the southern hemisphere is by a factor of 1/4.30 lower. This result is directly related to the
corresponding mean population densities which are 12.3/km2 for the whole world, 21.6/km2
for the northern hemisphere, and 2.9/km2 for the southern hemisphere (for the year 2000).
LONG TERM RE-ENTRY RISK ASSESSMENTThe probability Pi(φ) that an uncontrolled re-entry from a near circular orbit of inclination i occurs in a certain latitude band at φ ≤ i can be assessed by means of analytical equations [8],
assuming that for long-term risk forecasts the impact probability distribution in geographic
longitude λ is uniform, and the orbital inclination remains stable. Analytical results of Pi(φ) match well with a corresponding graphs in Fig.4, which were produced by numerical
quadrature. Tab.4 summarizes results of land impact probability Pl and casualty probability Pc for inclinations of 7.0° (e.g. Beppo-SAX), 28.5° (e.g. Shuttle payloads), and 51.6° (e.g.
Skylab, Salyut-7, Mir), 65.0° (e.g. Cosmos 954 and 1402), and 98.5° (Sun-synchronous
orbits), for a latitude bin width of Δφ = 0.5°. In order to link ground impact probability with
local land coverage and population density, single orbit arcs were produced in steps of
argument of true latitude of Δu = 1°, and in steps of geographic longitude of ascending node
of Δλn = 1° (for λn є [ 180°, +180°]). For each orbit arc the underlying maps of land masses
and population densities were sampled, weighted with the resident probabilities, and assigned
to bins of latitude φ (for Fig.5), bins of nodal longitude λn (for Fig.6), and (u,λn)-bins (for
Fig.7).
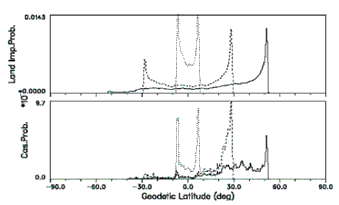
 Fig. 4. Impact probability for orbit inclinations of i = 7.0° (dolled),
28.8° (dashed), and 51.6° (solid line), as a function of geodetic latitude.
According to Fig.4, the highest impact probability Pi(φ) can be expected close to the extreme latitudes, where φ ≈ ±i. Since the integral value over all latitude bands is 1 by definition, the peak probability of Pi(φ) increases with decreasing inclination. After weighting of Pi with underlying land masses, the resulting land impact probability Pl shows a strong latitude asymmetry, as could be expected from Fig.3. This imbalance towards the northern hemisphere is further emphasized after weighting of Pi with local population densities to obtain a casualty probability Pc. Tab.4 summarizes the global land impact probabilities Pl and casualty probabilities Pс for orbits of different inclinations (for an assumed spacecraft casualty cross-section of Ac = 10 m2, and for the year 2000). The highest land impact probability is noted for i = 98.5°, while the largest mean casualty risk is encountered on orbits of i = 28.5°.
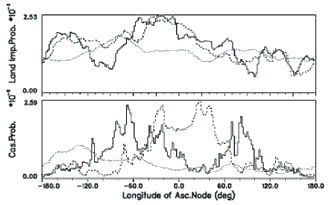
SHORT TERM RE-ENTRY RISK ASSESSMENT Fig. 7. Skylab, Salyut-7, and Mir re-entry groundtracks on a world population density map, for
a common inclination of 51°, as a function of geographic longitude of the ascending node λn, and of the orbit position (argument of true latitude u). The argument of true latitude average of
land cover (in %), and mean and max. population density (per km2) is given to the left.
When the predicted orbital lifetime of an uncontrolled re-entry drops below a few days, a
more detailed risk assessment should be performed. In this case, the drift corrected ground
impact corridor (e.g. of 2σ extension ±80 km cross track and ±2,000 km along track) needs to
be analyzed with the proper weighting by a 2D impact probability density function (PDF).
Such a PDF distribution may be obtained from a detailed analysis (e.g. by SCARAB) of a
disintegration process, and of the resulting survivor fragments. Their dispersion on ground
can be obtained by a variation of angle of attack and bank angle. A subsequent weighting of
the determined impact locations with probabilities of occurrence of the aerodynamic
assumptions leads to a probability density function PDFj(λ, φ) for the j-th ground impactor. In the case of no fragmentations, or in case only the global casualty cross-section Ac of the event is known, PDF(λ, φ) may be approximated by a 2D Gaussian distribution PDFnσ(sx,sy) in long
track direction sx, and cross track direction sy (centered at the predicted impact location), with corresponding nσ variances. For the subsequent analysis, a 2σ distribution shall be assumed,
with properties as shown in Tab.1. A detailed on-ground risk analysis can be performed by
quadrature of the 2-dimensional, 2σ probability density integrals via finite summations. One
obtains the following results for the impact probability Pi,2σ, the land impact probability Pl,2σ, and the probability of population casualties Pс,2σ for a given re-entry event [8].
 (6) (6) (7) (7) (8) (8)Here, the local impact probability is defined as
 (9) (9) (fl)n,m is the fraction of land coverage, and (ρp)n,m is the average population density in the sampled ground swath area bin. Ac is the spacecraft specific casualty cross-section, which
shall be adopted to be constant at 10m2 for all risk calculations within this paper (NASA
guidelines require that Ac ≤ 8m2 for all uncontrolled re-entries). In case of a fragment-wise analysis, eq.7 and eq.8 would have another outer summation over all survivor fragments.
RE-ENTRY RISK REDUCTION STRATEGIESA casualty probability of Pc < 1:10,000 per entry event is a figure which is proposed by NASA and which is also proposed (but not yet endorsed) for ESA projects. This number
appears to be an analytically justified balance between current risk levels (for today's world
population) on the one hand, and technically feasible mitigation and control measures on the
other hand. According to eq.8, Pc can be reduced below a given limit (Pc)max by controlling
the casualty cross-section Ac for the re-entering object (by engineering in the early design
phase), by selecting the re-entry area (and hence the incurred population density), or by
combining both strategies. If one assumes an accepted casualty probability of Pc ≤ 1:10,000 per re-entry event, Fig.8 shows how much casualty cross-section Ac may reach the ground for a given orbital inclination. The center curve shows the global average over all nodal
longitudes, while the vertical bars indicate the ranges within which Ac can vary, depending on
the geographic longitude λn of the ascending node of the orbit. λn(Ac,max) and λn(Ac,min) are
indicated for each inclination. In this analysis, single-orbit averages over one nodal revolution
are used. One can note that the ratios Ac,max(i)/Ac,min(i) may be on the order of 1,000 for some inclinations. For typical space station orbits near i = 50° (e.g. Skylab, Salyut-7, Mir and ISS) this ratio of maximum to minimum disposable casualty cross-section is still on the order of
50. Hence, a control of the nodal longitude of the final orbit can greatly reduce the on-ground
risk, or (for a given tolerated risk level) increase the allowed casualty cross-section. When
looking at the mean allowed Ac for Pc < 1:10,000 (see Fig.8), averaged over all inclinations,
and all nodal longitudes, then Ac is close to 8 m2 for the year 2000. This is the limit stipulated
by NASA in [13] for an uncontrolled re-entry. Hence, Ac < 8 m2 and Pc < 1:10,000 are
equivalent requirements for this epoch. In order to be unambiguous, it is, however,
recommended to adopt a limit on Pc, which will remain applicable as the world population
grows (in contrast to a limiting Ac). The acceptable level of casualty probability Pc could be lower for special missions (e.g. the US Department of Transportation and FAA recommend Pc < 1:33,333 for launch phases and dedicated re-entry missions [16]).
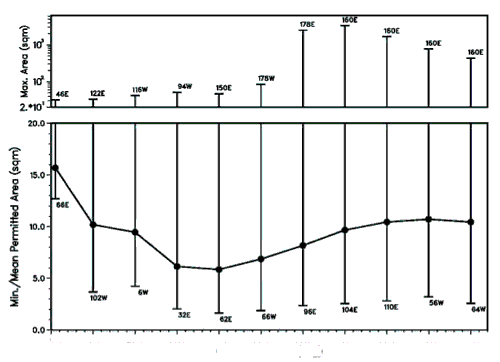 Fig. 8. Ranges of permitted casualty cross-section (minimum, mean, and maximum) for an accepted risk of 1 in 10,000 per event, and for near-circular re-entry orbits, as a function of inclination, for a world population in 2000.
HISTORIC RE-ENTRY EVENTSThe Salyut-7/Cosmos-1686 compound of 40 tons mass and 26 m length was left mothballed at 475 km in Aug 1986. From there it started its descent, which led to a final re-entry above
South America at 03:45 UTC on 07-Feb-1991 (see Fig.7). Due to an insufficient remnant of
propellant, a planned attitude change and corresponding drag modulation to control the impact
footprint could not be realized, and at least 3 major fragments could be retrieved after ground
impact. The geographic longitude of the ascending node of the Salyut-7/Cosmos-1686 re-
entry orbit was in the vicinity of λn ≈ 13°W. According to Fig.7 (label "Salyut-7") such a groundtrack leads to a global maximum of land coverage. The final casualty probability was
estimated to be Pc2σ ~ 1/7,050 (for Ac = 10m2). This value is close to the global average of
1/7,650 for this orbit inclination of 51.5°.
In Feb 1974 Skylab, a 74 ton compound of dimensions 25.6 m × 6.6 m, was left in a 441
km near-circular orbit of 50.0° inclination. Due to an unexpected high level of solar activity
with the approach of the maximum of solar cycle 21, the 10 year lifetime predicted in early
1974, was significantly shortened, and Skylab re-entered on 11-Jul-1979. Prior to the re-entry,
Skylab was reactivated on 06-Mar-1978. Re-entry predictions during the last 24 hours of the
orbital lifetime were all located on a single groundtrack with an ascending node at λn =
174°W. Fig.7 shows that this longitude, which was attained by an orbit energy management
strategy, results in a re-entry ground swath with a global minimum in mean population
density, and hence in mean casualty probability. Forecasts indicated, however, that the
predicted impact location started to settle on the densely populated USA. At T-13h before the
predicted entry, the land impact probability was 19.3%, and the casualty probability was
1/31,600 (for Ac = 10m2). In order to reduce the risk further, Skylab was taken out of its torque-equilibrium attitude (TEA) and put into a tumbling motion at 07:45 UTC on 11-Jul-1979. This led to a drag reduction by some 20%, moving the impact location down track by
about one half orbit, and placing the impact right between two successive passes of the North
American landmass. Thus, the probability of land impact was reduced to 16.5%, and the
population casualty risk was reduced by almost 25% to 1/40,509. This risk figure corresponds
to less than 20% of the global mean casualty risk of 1/7,750 for a reference spacecraft
casualty cross section of 10m2. The reconstructed impact of Skylab was determined to be at
16:37 UTC, in Australia, at 32°S and 124°E. Several large fragments could be retrieved from
ground, including a water tank, a heat exchanger, an airlock shroud, oxygen bottles, and a
film vault (sequence according to down-track range).
Mir, a successor of the Salyut-7 space station with a mass of 135 tons, and an extension
of 30 m in all three dimensions, was de-orbited in a controlled manner on 23-Mar-2001.
Following a natural orbital decay to about 215 km mean altitude, the space station re-entered,
following a 3-burn maneuver strategy within 4 consecutive orbits, leading to a splash down
near λ = -160.0° and φ = -40.0°, at 06:00 UTC, well inside its envisaged re-entry zone in the
South Pacific. With 51.6° Mir had the same orbital inclination as Salyut-7. Moreover, its de-
orbit took place on almost the same final groundtrack as the decay of Salyut-7, with the major
difference that the phasing of the Mir re-entry position on that orbit was fully controlled and
optimized, such that the distance to the nearest land masses was maximized, and the on
ground risk was minimized to virtually zero (compare Fig.7). This demonstrates that even
large, massive objects can be safely de-orbited, if adequate design and operational provisions
are taken (for ISS similar de-orbiting procedures are considered).
RE-ENTRY RISK ASSESSMENT WITH THE DRAMA TOOLSeveral space agencies and international entities have adopted space debris mitigation
standards, guidelines, or codes of conduct. An important issue, which is addressed in most of
these, is the post-mission removal of space systems, particularly from the densely populated
low Earth orbit (LEO) region. This is an important measure to conserve the stability of the
LEO environment in the long-term. It can be accomplished by direct de-orbiting, delayed de-
orbiting to a reduced lifetime orbit, or re-orbiting to super-LEO altitudes. In the case of de-
orbiting, a spacecraft or upper stage should enter into the Earth atmosphere within 25 years or
less for delayed de-orbiting, and within less that one revolution for direct de-orbiting. Some
space debris mitigation standards also request that the risk on ground due to a single re-entry
event must not exceed a certain tolerated casualty probability (e.g. 1 in 10,000 [8]). Since
mission operators should ideally comply with both, the 25 year rule for maximum post-
mission lifetime, and the limitation of on-ground risk, they must be provided with a means to
verify their compliance. For this purpose, NASA has developed the DAS tool (NASA Debris
Assessment Software [14]). In one of its analysis modes DAS checks the survival of a
spacecraft which is composed of several simplified object shapes of uniform material
properties, and which is exposed to a re-entry, starting with given initial conditions of the
trajectory. The risk is evaluated on the basis of the surviving casualty cross-section [13], for a
latitude dependent world population model. A tool similar to DAS is nearing completion in
Europe. Under ESA contract and with ESA participation the DRAMA software has been developed (ESA Debris Risk Assessment and Mitigation Analysis [10]). One of the purposes
of DRAMA is to check compliance of a re-entry event with requirements from a future
European Space Debris Mitigation Standard. The tool allows to define a re-entry object as a
composite of simple-shape bodies, each with uniform material properties. This composite is
propagated from an initial condition near 120 km altitude to burn-up altitude or ground impact
location of its individual components. The on-ground risk for each survivor object is
integrated over a 1? impact swath, and cumulated into an overall event-related risk. Two different assessment modes are offered: (1) a high-resolution, short-term analysis mode, using
longitude and latitude dependent population densities within a 1? impact swath, and (2) a
low-resolution, long-term analysis mode, assuming a purely latitude dependent population
density distribution, and a uniform impact probability over the orbit. As of early 2005 the
DRAMA software will be available free-of-charge for Solaris, Linux, and Window systems.
Requests can be addressed to the author.
SUMMARY AND CONCLUSIONSThe risk analysis for uncontrolled re-entries from orbits of 51.5° inclination (e.g. Skylab,
Salyut-7, Mir, and ISS), and the long-term, globally averaged risk assessment for such
inclinations results in 2σ population casualty probabilities Pc,2σ which are of the same order of magnitude as the permissible threshold of Pc,2σ ≤ 1/10,000, which NASA defines for a single
uncontrolled re-entry event (assuming a spacecraft casualty cross section of Ac ≤ 8m2). For the partially controlled natural re-entry of Skylab, this risk level was reduced by more than a
factor of 5. In case of the fully controlled de-orbit of Mir, the casualty risk was virtually
reduced to zero, by placing the impact footprint in an uninhabited area.
If one cumulates several pessimistic assumptions (i.e. all 19,000 historic re-entries
caused a ground impact with a mean casualty cross-section of 8 m2, and the Earth population
was constant at the year 2000 level), then the cumulated risk of casualties would be about 1 in
45 years. This risk can be translated into an equivalent personal risk. For a US citizen, the risk
to be killed before reaching the age 50 is about 1 in 7 × 10+9 due to debris impacts, 1 in
20,000 due to asteroid impacts, 1 in 300 due to homicides, and 1 in 150 due to car accidents.
Hence, in spite of the wide public attention which is paid to uncontrolled re-entries, the
associated probability of casualties is several orders of magnitude below the level of day to
day risks which are commonly accepted.
REFERENCES
Размещен 21 декабря 2006.
|
|
|
|
|
|
|
|
|