


|
|
|
|
|
|
|
|
EVOLVING SPACE SURVEILLANCE CAPABILITIES – MATHEMATICAL RAMEWORK FOR EVALUATING FUTURE SURVEILLANCE NETWORKSSusan AndrewsMIT Lincoln Laboratory, 244 Wood Street, S4-600D, Lexington, MA 02420
1. INTRODUCTIONThe use of Earth-orbital space has changed significantly in the past fifteen years. From a
domain where most of the space assets belonged to major international powers during the
early 1990s and the assets were predominantly used for national security or national-level
scientific investigations, use of space has evolved to include a much broader variety of
participants and of functions. Through the development of commercial launch services, many
more countries and organizations have access to launch. Technology evolution has enabled
development of small and inexpensive satellites, and as access to space has become more
available, more reliable, and less expensive, the world of developers has been expanding the
services and products offered by space in support of civil, commercial and small-scale
scientific users in addition to the national security communities. Given the recent pace of both
technology advances in electronics and the addition of developers and functions for space
systems, many observers project this fast-paced evolution of space use to continue.
As the diversity of space asset owners and of spacecraft functions increases, the
requirements for space surveillance change. Evolution and revolutions in the world socio-
political situation also change both the use of space and the requirements on space
surveillance. The differences between today’s world and that of 1990 have necessitated major
changes in space surveillance operations, and architects for the space surveillance networks of
the future are projecting that the needs of 2020 will be notably different still. Unfortunately,
the time required for a single space surveillance network to develop a significant new
capability is much longer than the time between typical significant developments on a
worldwide basis. The space surveillance system needed to meet the needs of fifteen to twenty
years from now will likely need several new capabilities that are more than simple extensions
of existing ones. As such, architects of the future systems are faced with a choice between
designing an architecture to meet today’s shortfalls, selecting one possible future and
designing to that, and projecting a myriad of possible futures and trying to identify a
compromise solution.
Given a single projected future, multivariate utility analysis provides an established
technique for evaluating the suitability of a system to address a specified set of related tasks
and to rank the merits of competing systems. This technique has users define a set of
performance parameters to use as the basis for evaluation. Users can prioritize these
performance parameters in terms of relative importance (e.g., the importance of timeliness to
completion versus accuracy) and specify that set of preferences numerically with a set of
numbers referred to as weights. For each parameter, users may also assign increasing merit to
improving performance, so that systems that almost meet a requirement threshold show
higher merit than those falling far short of the requirement (e.g., if the requirement for
timeliness of completion is 30 minutes and completion in 35 minutes is almost as useful, the
merit for 35 minutes is close to that of 30 minutes and greater than that of 180 minutes). The
merit is specified numerically using a function, called a utility function, that maps
performance capabilities to a predefined range of numbers. The specification of prioritization
and merit are jointly referred to as user preferences.
The mechanics of multivariate utility analysis are straightforward and easy to automate
in software. The technique works well when the desired performance parameters and the
trades among them are well understood. The difficult portion of the process is capturing the
user preferences. Researchers have developed a variety of tools to help codify and capture
these specifications from groups of users, but the process requires time and effort even with
the tools. In addition, the process is easier when the participants have a fixed idea of their
needs. A requirement to project well into the future for technology research and development
goals adds to the difficulty of specifying the user preferences. People looking at systems to
meet goals of a fifteen-year future often consider a range of possible futures, and different participants may have different visions. Combining the prospect of multiple and disparate
potential futures with the activity of specifying user preferences for a specific future vision
just multiplies the difficulty of the process.
Space surveillance is a multi-faceted activity with a variety of tasks, and different world
futures will stress different tasks. Even with a disciplined method for determining user
preferences, the user community is free to envision multiple future operating environment
scenarios for the space surveillance network and will want to know the merit of a candidate
architecture for each scenario to see how robust the candidate network is to the operating
environment. For example, if space becomes an entirely peaceful realm heavily used for civil,
commercial, and humanitarian needs, the requirements for space surveillance are different
than a future in which third-party actors are actively trying to upset world stability through
offensive acts against space assets.
As new architectures are brought into consideration, it is common for evaluators to want
to know how the architecture candidates will fare against new scenarios for the future in
addition to those previously considered. Some of the new scenarios may be combinations of
previously considered scenarios, such as a high civil and commercial use of space along with
a modest threat of offensive acts in space. Multivariate utility analysis will allow a merit to be
assessed for each candidate architecture for each envisioned scenario for the future; however
it requires that, for each future scenario and for each performance parameter of interest in that
scenario, the user community specify a new utility function and weight. Since specification of
user preferences is an unwieldy process, evaluators often resort to ad hoc processes to make
the overall merit assessments manageable.
The utility framework described in this paper was developed to address the difficulty of
eliciting user preferences for a space surveillance network in consideration of multiple visions
for the future. It enhances current multivariate utility techniques in the following ways:
This utility framework uses the new techniques combined with specific rules for
mathematically representing user preferences to accomplish the following:
This paper will define the concepts of utility space and extreme users and describe how
they support consideration over a range of operating environments. Section 2 introduces the
utility space concept and Section 3 describes the multivariate utility framework for evaluating
system merit for a single future user. Section 4 will describe the use of extreme users and the
definition of candidate users from the extreme users. Section 5 will define two sets of combination functions for yielding merit for candidate systems for arbitrary users based on
the user preferences of the extreme users. Section 6 provides a representative space
surveillance architecture example and Section 7 provides a brief summary.
2. UTILITY SPACE CONCEPTThe classic toolset for conducting system trades works from the understanding that each
performance capability (e.g., completing a job in x minutes) or outcome (e.g., false alarm) has
a benefit and/or cost that can be represented numerically. These numeric representations are
relative, and this paper uses the term ‘utility’ to refer to that representation (also known as
cost or value in the literature). A utility function maps performance capabilities into utilities,
with better performance mapping to higher utility. When evaluating a complex system, the
merit of the system is a function of the utilities of the individual performance capabilities or
outcomes. If considering a system with non-deterministic outcomes, then the probability of
each possible outcome is folded into the calculus. Depending upon the nature of the
evaluation, functions using sums or products of the utilities for individual performance
parameters are common ways to create functions yielding overall system merit. The proposed
framework uses a weighted sum, and utilities are bounded for both the performance
capabilities and on the system as a whole to allow for an absolute assessment of merit with
respect to an ideal system.
To reduce the difficulty of specifying user preferences for multiple possible futures, our
three goals were to a) reduce the number of weights and utility functions that need to be
specified manually while still allowing for a large number of variants on the future, b) find a
practical way to specify multiple sets of utility functions for performance parameters for a
future space surveillance architecture with respect to different poorly defined future scenarios,
and c) provide means to evaluate overall system performance over a range of possible user
preferences. The key concept is the creation of a mathematical space of utility functions,
where space is meant in the traditional mathematical sense. Every utility function in the space
can be formed by an operation performed on a specific small subset of utility functions, and
that operation is called ‘combination’. For any given evaluation problem and a small set of
users that represent the extremes, the space of utility functions for each performance
parameter is created by defining extreme user preferences for that parameter. The utility
functions specified for the extreme users are the ones used in the combination operation.
The extreme users and their utility functions are created according to the following three
guidelines:
For each extreme user and for every performance parameter, utility functions are then
defined. Due to the ‘focus’ of the extreme user, it should be easier to determine the utility
functions for these users than for a realistic multi-functional user community. These extreme user utility functions define, for each performance parameter, the extreme points of a convex
utility function space. The utility functions for a candidate user are determined by both the
extreme user utilities and how the candidate is mathematically represented as a combination
of the extreme users. Similarly, the parameter weights are determined by the extreme user
weights and the candidate’s likeness to the extreme users.
3. SINGLE-USER SYSTEM EVALUATION PROCESSThe process for evaluating a candidate system with respect to a single user forms the basis for
the multi-user work. We have chosen a utility representation in which the utility for a system
as a whole can be represented as a weighted sum of the utility of the individual performance
parameters, where the weights are those specifying the relative importance of the individual
parameters. Use of weights and parameter-specific utility functions allows for modular
computation. Furthermore, the contribution to system merit of a single parameter or group of
parameters is easy to determine. This approach does, however, require certain assumptions
about the independence of parameters, and it limits the ability to represent the case that a
system has no value to a user if minimal performance cannot be met on a single, specific
performance parameter. In contrast, a joint non-separable utility function on all of the
parameters together can lead to complex calculations and difficulty determining component
contributions.
The evaluation process for the single user within our framework has the following steps:
Parameters for evaluation are drawn from notional requirements, identified needs, and
desired properties. This set defines the measures of performance, and a broad set can be
selected to ensure coverage of all key user needs. A performance metric (e.g., time) and units
are selected for each capability. To keep the problem bounded and in concert with reality, a
finite range of relevant performance values should be identified. Often this range is bounded
by a best and worse performance.
Weights are assigned to each parameter to represent the relative importance of one
parameter versus another. The proposed framework restricts weight to non-negative numbers
and allocates a total weight that must be divided among the performance parameters. In our
case, the sum of the weights over all parameters was set to 100, since percents are a natural
representation. A user assigns high weight to a performance parameter that has high
importance with respect to other performance parameters. Note that setting of weights should
be distinct from consideration of the difficulty to achieve a useful level of performance.
Consider two users: 1) a man with a car with elite tastes and significant resources; and 2) a
young family man with no car. The first man considers only the highest quality luxury train
service satisfactory, but does not particularly need train service to be provided. The second
finds any train service meeting basic safety, reliability and comfort standards to be acceptable,
but requires that such train service be available to enable him to support his family. Weights
should capture the need to achieve success in performance (e.g., whether train service is
important at the desired quality); utilities should capture the quality of performance (e.g.,
whether it must be luxury-quality train service).
When performance parameters can be grouped into logical categories (e.g., parameters
related to positional accuracy), evaluation teams may find it easier to look at the relative
importance of one category with respect to another. Once evaluation teams assign weights to categories, evaluators can assess the relative importance of one parameter in the category to
another and allocate individual weights from the group weights. This grouping technique was
useful in several studies evaluating space surveillance architectures.
The utility function is defined for each performance parameter based on how the user
wants the system to perform on that parameter. For this work, all utility functions have a
common minimum of zero and a common maximum value, and the maximum value should
be achieved over the range of performance values. In the studies conducted using this
framework, evaluators specifying utility functions appeared to find that a value of 5 was a
comfortable maximum. For every performance parameter, the utility function is defined over
the range of performance values bounded by the previously selected performance parameter
range.
Note that utility does not need to be an increasing function in the metric selected (e.g., if
the performance parameter is the time to find an object in low earth orbit and the unit is
minutes, higher utility is assigned to lower numbers of minutes). Utility functions do not need
to be linear in the units of performance. Concave-up monotonic functions represent users who
require near the best possible level of performance to yield a high utility (a stressing utility
function). Monotonic functions that are concave-down will grant a relatively high utility to
modest performance. Utility functions do not need to be monotonic, however care must be
taken to specify the range of performance values to be considered in such cases.
The evaluation community found it useful to have a set of parameterized functions to
draw from that was appropriate to representing performance parameter utilities. The set of
functions offered a variety of shape options (segmented linear, segmented concave, or step)
and input parameters would let them set transition points (e.g., points for steps or inflections)
as well as slope or curvature. This reduced the overhead of having evaluators define functions
from scratch.
After the performance parameters have been specified, the performance of the candidate
system is assessed versus each performance parameter and recorded. For each performance
parameter, the candidate system performance is scored according to the utility function for
that user and performance parameter. The total score for a system is then determined by
multiplying the utility assessed for the candidate’s performance in each parameter by the
corresponding user weight and summing this product over all performance parameters. We
found renormalizing the total system score to a scale of 0-100 produced results on a
commonly used reference scale. Figure 1 shows an example of the evaluation mechanics.
 Fig. 1. Example illustrating single-user evaluation mechanics
To summarize the basic mechanics:
For a given user, the utility of a candidate system is the weighted sum of the utilities for the performance parameters. The maximum possible system utility is the maximum value of the utility function times the constant that is the sum of the weights over the set of parameters. The minimum utility of a system is zero. This construct supports assessment of system merit with respect to a given user in absolute terms, as well as its merit in comparison with another system. The process of assessing utilities of system performance on a parameter-by-parameter basis, multiplying by the corresponding weights, and summing is used for merit evaluation in the utility space concept. The primary difference is the source of the utility functions and weights. 4. SYSTEM EVALUATION PROCESS USING EXTREME USERSThe process for evaluating a candidate system under the proposed framework is similar to that
for the single user case.
As described previously, each extreme user represents a future dominated by a single
guiding principle. The “Traffic Management” and “Space Threat Awareness” users are two
examples. The set of extreme users should be selected to represent the most stressing user
with that focus envisioned within the given timelines, since any less stressing user of the same
focus can be created from a combination of the extreme user and the “I don’t care” user. The
extreme user set selected should be the smallest set possible that still allows for representation
of any potential user group within the projected timeframe as a combination of the extreme
users. Characteristics and goals of these extreme users should be laid out clearly.
Definition of performance parameters follows as with the single user case, however all
parameters appropriate to any projected user should be included. A parameter that is
irrelevant to an extreme user should be weighted zero by that user and assigned a uniform
maximum utility. The range of performance values under consideration should include all
performance values of interest to any user. For each parameter, the utility function for each
extreme user will be defined over this entire range of performance values, although some
extreme users may only assign non-maximum, non-minimum utilities to a portion of the
range.
For each extreme user, assignment of weights and utility functions follows as with the
single user. For each extreme user, the total weight allocation is the same (e.g., weights sum
to 100). For each extreme user, for every parameter, the maximum value of the utility
function is the same and the minimum value is no less than zero.
The candidate user is characterized by assessing its similarity to each functional
extreme user. The similarity to the “I don’t care” extreme user is captured through the similarities to the set of functional extreme users. A number in the range [0,1] represents the
similarity to each extreme user, with 1 implying that the candidate user has the full
characteristics of that extreme user, or full commitment to that extreme user. An assignment
of 0 implies no similarity to the focus of that user. The number assigned is referred to as the
“influence” of the extreme user on the candidate user. It is possible to have a candidate user
that has the full characteristics of each of the extreme users (representing a very assertive
multi-mission user community). Similarly, it is possible to have a candidate user that has no
characteristics of any extreme user. If the extreme user set was properly selected, this ‘no
characteristics’ case should represent a user with no real interest in how well the system
performs against the performance parameters.
The candidate user specification is not an allocation of a fixed total weight among
extreme users such that the sum of the influence numbers is one. The level of similarity to
each user is independent of the similarity to other users. Suppose a candidate user is equally
similar to each of n extreme users. If the common similarity to all users was represented by
1/n, then there is no way to differentiate between a strong, proactive user community willing
to dedicate a large amount of funding and a “get a reasonable compromise” community with
modest funding. The candidate user can be represented as a coordinate in user space, with the
focus for each extreme user defining an axis and the extreme user at the unit point on the
corresponding axis.
Once the utilities for a candidate system are determined for every extreme user and the
influence vector defining the candidate user is specified, the extreme user utilities and
candidate influence vector are fed to the utility combination function to yield the utility vector
for the candidate user. Similarly, the extreme user weights and candidate influence vector are
fed to the weight combination function to yield a weight set for the candidate user. As with
the single-user case, the system score for the candidate system is created by multiplying the
candidate user utility for each system performance parameter by the corresponding candidate
weight and summing over the performance parameters.
5. WEIGHT AND UTILITY COMBINATION FUNCTIONSThere are a variety of weight and utility combination functions that will achieve the properties
of a bounded space of utilities, where the bounds are determined by the extreme user utility
functions. This section describes one weight combination function and two utility
combination functions along with the rationale for selecting them. The notation below is used
in their specification:
A natural combination function to generate weights for a candidate user is defined by
Equation 1. This function yields a valid weight set such that the sum over all parameters
equals wsum. Since one parameter can only be prioritized at the cost of others, this function
represents the compromise of two users with different priority distributions. The compromise
takes the influence of EUj into account by scaling the impact of EUj’s weight by ej,
 (1) (1)It is natural to try a function of the same nature to combine utility functions; creating a
new utility by a weighted averaging of the extreme user utilities. We argue that approach has
the following shortcomings:
It is possible to add the “I don’t care user” into such a weighted averaging by assigning
an influence to that user equal to the result of summing over all functional extreme users the
difference between 1 and the influence number of each extreme user. This is equivalent to
assigning the difference between the number of functional users and the sum of their
influence numbers. The total influence, including the “I don’t care” user (the denominator in
the weighted sum) would be equal to the number of functional extreme users, and the
resulting utility would be uic = 1/n [umax(n – ej) + uijej]. What this option fails to represent is
the case where a candidate user has full influence of each functional extreme user (influence
number ej = 1 for each extreme user). The weighted sum would average the utilities over all
extreme users, and we assert that given equivalent parameter weightings among the extreme
users, the utility score should be no higher than that of any extreme user to whom the
candidate is fully committed. In other words, if a stressing user is willing to bring his full
force (and funding) to the architecture specification, then his full needs should be met for the
system to receive a good score.
In consideration of a need to represent varying levels of influence of multiple types of
users, the following are the desired properties for a utility combination function:
Both of the combination functions proposed in this paper are determined on a
parameter-by-parameter basis and for each parameter are based on the evaluated extreme user
utilities for a specific performance value, pki. Each combination function requires that the
resulting extreme user utilities uij(pki) be ordered from minimum to maximum utility, which is
referred as “most stressing” to “least stressing”. This ordering will shift with respect to the
order of the definition of the extreme users as a function of performance parameter and even
values of performance within a parameter. Therefore, the notation uij(l)(pki) represents the
extreme user utilities on pki in ascending order (i.e., uij(l)(pki) ≤ uij(l+1)(pki)). An additional term
and notation are required for the definition of both functions. The “discount”, dij(l), represents
the amount of discount applied to the influence of extreme user j(l) on the combined utility for
parameter i based on the influence of extreme users with more stressing utility functions. The
discount is computed recursively, as shown in Equation 2, with dij(1)=0.
 (2) (2)Equation 3 shows utility combination function A, and it is shown in expanded form for
the four-user case in Equation 4. It meets all of the desired properties and is a good example
of how utility functions for multiple users might be combined when there is only one
performance parameter of interest. If the hypercube bounded by the points (0,0,…,0),
(0,0,…,1), …, (0,1,…,0), (1,0,…,0), and (1,1,…,1) is considered (representing the n
functional extreme users, the “I don’t care user”, and all of the extreme users at full influence
level), then the effect on utility for the most stressing user, j(1), is represented by the volume
within the hypercube bounded by xj(1) ≤ ej(1). The effect of the next most stressing extreme
user, j(2), is the volume xj(2) ≤ ej(2), xj(1) > ej(1), which is proportional to ej(2)*(1-ej(1)) and the
effect of the second most stressing user is reduced by the volume already considered by the
first. Figure 2 shows this in two dimensions. Equation 4 shows that if ej(l)=1, the terms for less
stressing extreme users zero out. Table 1 demonstrates a sample calculation for one
parameter, where columns 2-4 show the utilities for the extreme users.
 (3) (3) (4) (4)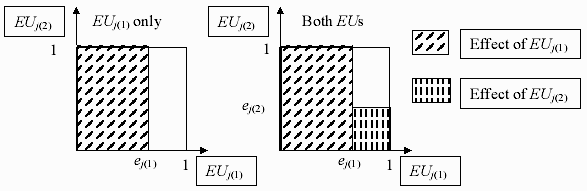 Fig. 2. Effect of ordered extreme users on candidate utility
Table 1. Extreme user (columns 2-4) and candidate user (columns 5-8) utilities, function A
Figure 3 shows the progression of utility curves for candidate users based on a single
functional extreme user and the influence number for that extreme user set at 1.0, 0.8, 0.6, 0.4,
0.2, and 0.0. Note that the characteristic curvature of the original utility function is retained
and the primary change is that of raising the minimal value. This is consistent with the notion
that the “I don’t care user” will grant a maximum score to any level of performance. Figure 4
shows an example of a case with two extreme users and combinations with various influence
vectors. Note how the most stressing user affects the curves, even when which user is most
stressing changes at 800 m.
 Fig. 3. Graduated utility with changing influence from one user
 Fig. 4. Combination with two users and crossing utility functions
Combination function A provides reasonable results when the most stressing utility for
a given performance corresponds to the extreme user with the highest weight among the users
for that parameter. It produced counterintuitive results when the ordering of weights did not
map to the same set of extreme users as the ordering of utilities and the differences in the
weights was significant. The utility of the stressing user dominates even if the user has a low
priority for the performance parameter. As a result, the network scores may underrate total
satisfaction of the multiple users of the candidate system.
Combination function B adjusts for the low weight/high stress discrepancy of function
A by modifying the discount to include a term related to the extreme user weights. The term
fij(l) is between zero and one, and it scales the discount dij(l). Equation 5 defines fij(l), where
wi max is the maximum weight for performance parameter Mi over the extreme users. Equation
6 shows the adjustment to the discount, dij(l), and Equation 7 shows combination function B.
Note that if the weights for the extreme users are the same, then combination functions A and
B are the same. If the weights are different, then the effect of an extreme user is scaled down
based on the relative weight difference between that user and the highest weighting user.
Since a user’s raw impact is based on how stressing it is compared with other users, the effect
of the fij(l) scaling is greater when a more stressing user has a lower weight than a less
stressing user. Normalizing by wsum means that small differences in weights relative to the
total weight allocation yield little effect.
 (5) (5) (6) (6) (7) (7)6. EXAMPLE WITH MULTIPLE PARAMETERS AND BOTH COMBINATION FUNCTIONSThe following example is again drawn from the problem of developing an architecture to
support space surveillance in the ten to fifteen year future. The performance parameters and
extreme users are realistic but simplified. The utility functions and weights are selected
strictly for the purposes of illustrating the two combination functions (and their differences) and are not representative of US government needs or priorities. The utility scores for
parameters are out of a maximum of 5, weights for a user sum to 100, and system scores are
normalized to 0-100 scale.
The two extreme users selected for this example are; a) “space threat awareness” user,
who wants to know what is in earth orbit on a very timely basis to determine whether there is
something potentially hostile, and b) the ‘space traffic management’ user, whose job it is to
maintain easy use of space with limited risk of collision or interference for all operators.
Jointly, the two users are interested in five performance parameters: 1) the time for access to
track a satellite with maximum altitude less than 6000 km; 2) the minimum size of object that
can be tracked by the system; 3) the accuracy to which an object’s location can be estimated
in low Earth orbit; 4) the minimum size of an object detectable at GEO; and 5) the capacity of
the system in low Earth object tracks/day. Figure 5 (next page) shows the five sets of utility
curves, with filled squares for the awareness user and X-markers for the traffic management
user. The figure includes a table with the weights for each extreme user. Two candidate users
are selected; C1 has half similarity to each of the extreme users, C2 has full similarity to the
awareness user and half similarity to the traffic management user.
Table 2 shows a notional performance level of a candidate system in each parameter,
the utility assigned by each extreme user to each parameter, the utility for each performance
value for each of the two candidate users under combination function A and the
corresponding set of utilities under combination function B. The rows are shaded gray for the
parameters for which the most stressing extreme user is not the one who weights the
parameter highest. Note that the parameter scores in the non-shaded rows are similar for the
two combination rules, while they are notably higher for combination function B in the
shaded rows. In particular, even though C2 is fully committed to the awareness user, C2
utilities do not default to the more stressing awareness utilities when the awareness weights
are much lower than those for the traffic user. The overall score is higher for Combination B.
Table 2. Candidate System Utilities for Multi-parameter Example
Fig. 5. User preferences for multi-parameter example
7. SUMMARY AND FUTURE WORKThis paper describes a framework for multivariate utility analysis that supports evaluation of
multi-function systems in the context of a future user when the nature of that future user is
uncertain. The problem of specifying utilities for arbitrary users is reduced to a parametric
one, where only a small set of single-minded users need to be characterized in terms of
weights and utilities, and the preferences for all other users can be generated mathematically
from the preferences of the few. In addition, the use of extreme users provides a measure of
worst-case utility over all envisioned users.
Two combination functions were proposed for generating user preferences from the
preferences of extreme users. Each function represents the additive effects of multiple user needs on the development of a multi-functional system-of-systems, as well as the differences
between a seriously interested user and a moderately interested user with the same focus. The
first function provides more stressing utility functions, dominated by the more stressing user
for each parameter. The second function reduced the impact of users who place a lower
priority on a parameter than other users.
Future work will include research into other combination functions. Two specific areas
have been identified for exploration. The first is based on an observation that if an extreme
user assigns a utility of zero to a range of performance capabilities, when the influence
number for that extreme user is less than one and no other extreme users are considered, the
utility for that entire range is raised to a uniform value. It may be more representative to have
some ramping up in utility over that originally zeroed range. The second returns to the earlier
observation that this framework does not provide the means to represent the case in which a
user has one or more key parameters such that the candidate system should be assigned zero
utility if its performance in the any of the key parameters is not better than the corresponding
threshold. A multiplicative component to the calculation of system utility might be
appropriate (as opposed to the current weighted sum), but work is needed to identify ways to
incorporate such a component while maintaining the desired utility and combination
properties.
The algorithms are relatively simple to program and were initially implemented as
Visual Basic macros in combination with a Microsoft Excel workbook. This implementation
supported evaluation of more than fifty candidate space surveillance architectures against fifty
parameters for four extreme users. To support analysis of several thousand candidates and a
larger number of extreme users, a MATLAB version of the code was developed. Since both
implementations were developed in support of specific evaluation efforts, user interfaces were
cumbersome and required detailed knowledge of the program and data entry interface. While
it was easy for an experienced user to add new candidates for evaluation, it was a highly
manual process to add the results to charts and graphs that compared candidates. Work is
currently in progress to implement the algorithms in a user-friendly package that does not
require extensive knowledge of MSExcel and that provides easy commands to generate
commonly desired charts and graphs.
Acknowledgements. This work was sponsored by the Dept. of the Air Force under Air Force Contract
NoFA8721-05-C-0002. Opinions, interpretations, conclusions and recommendations are those of the
author and are not necessarily endorsed by the United States Government.
REFERENCES
Размещен 28 ноября 2006
| ||||||||||||||||||||||||||||||||||||||||||||||||||||||||||||||||||||||||||||||||||||||||||||||||||||||||||||||||||||||||||||||||||||||||||||||||||||||||||
|
|
|
|
|
|
|
|


